Skip to content

Benchmarks

The Benchmarks view lets a site compare its own numbers against a group of similar merchants (same industry, same traffic volume band). It covers:

  • how many rules the site has enabled,
  • how well the identity and spend categories are covered,
  • how often mandates are blocked,
  • how often a human reviewer is asked to step in,
  • and how fast decisions resolve.

Benchmarks is read-only and opt-in. Aggregates are shown only in the opted-in merchant’s own dashboard — never to another merchant, and never to Sill’s sales or marketing teams.

The v1 view is honest about what is real and what is a placeholder. Read this first:

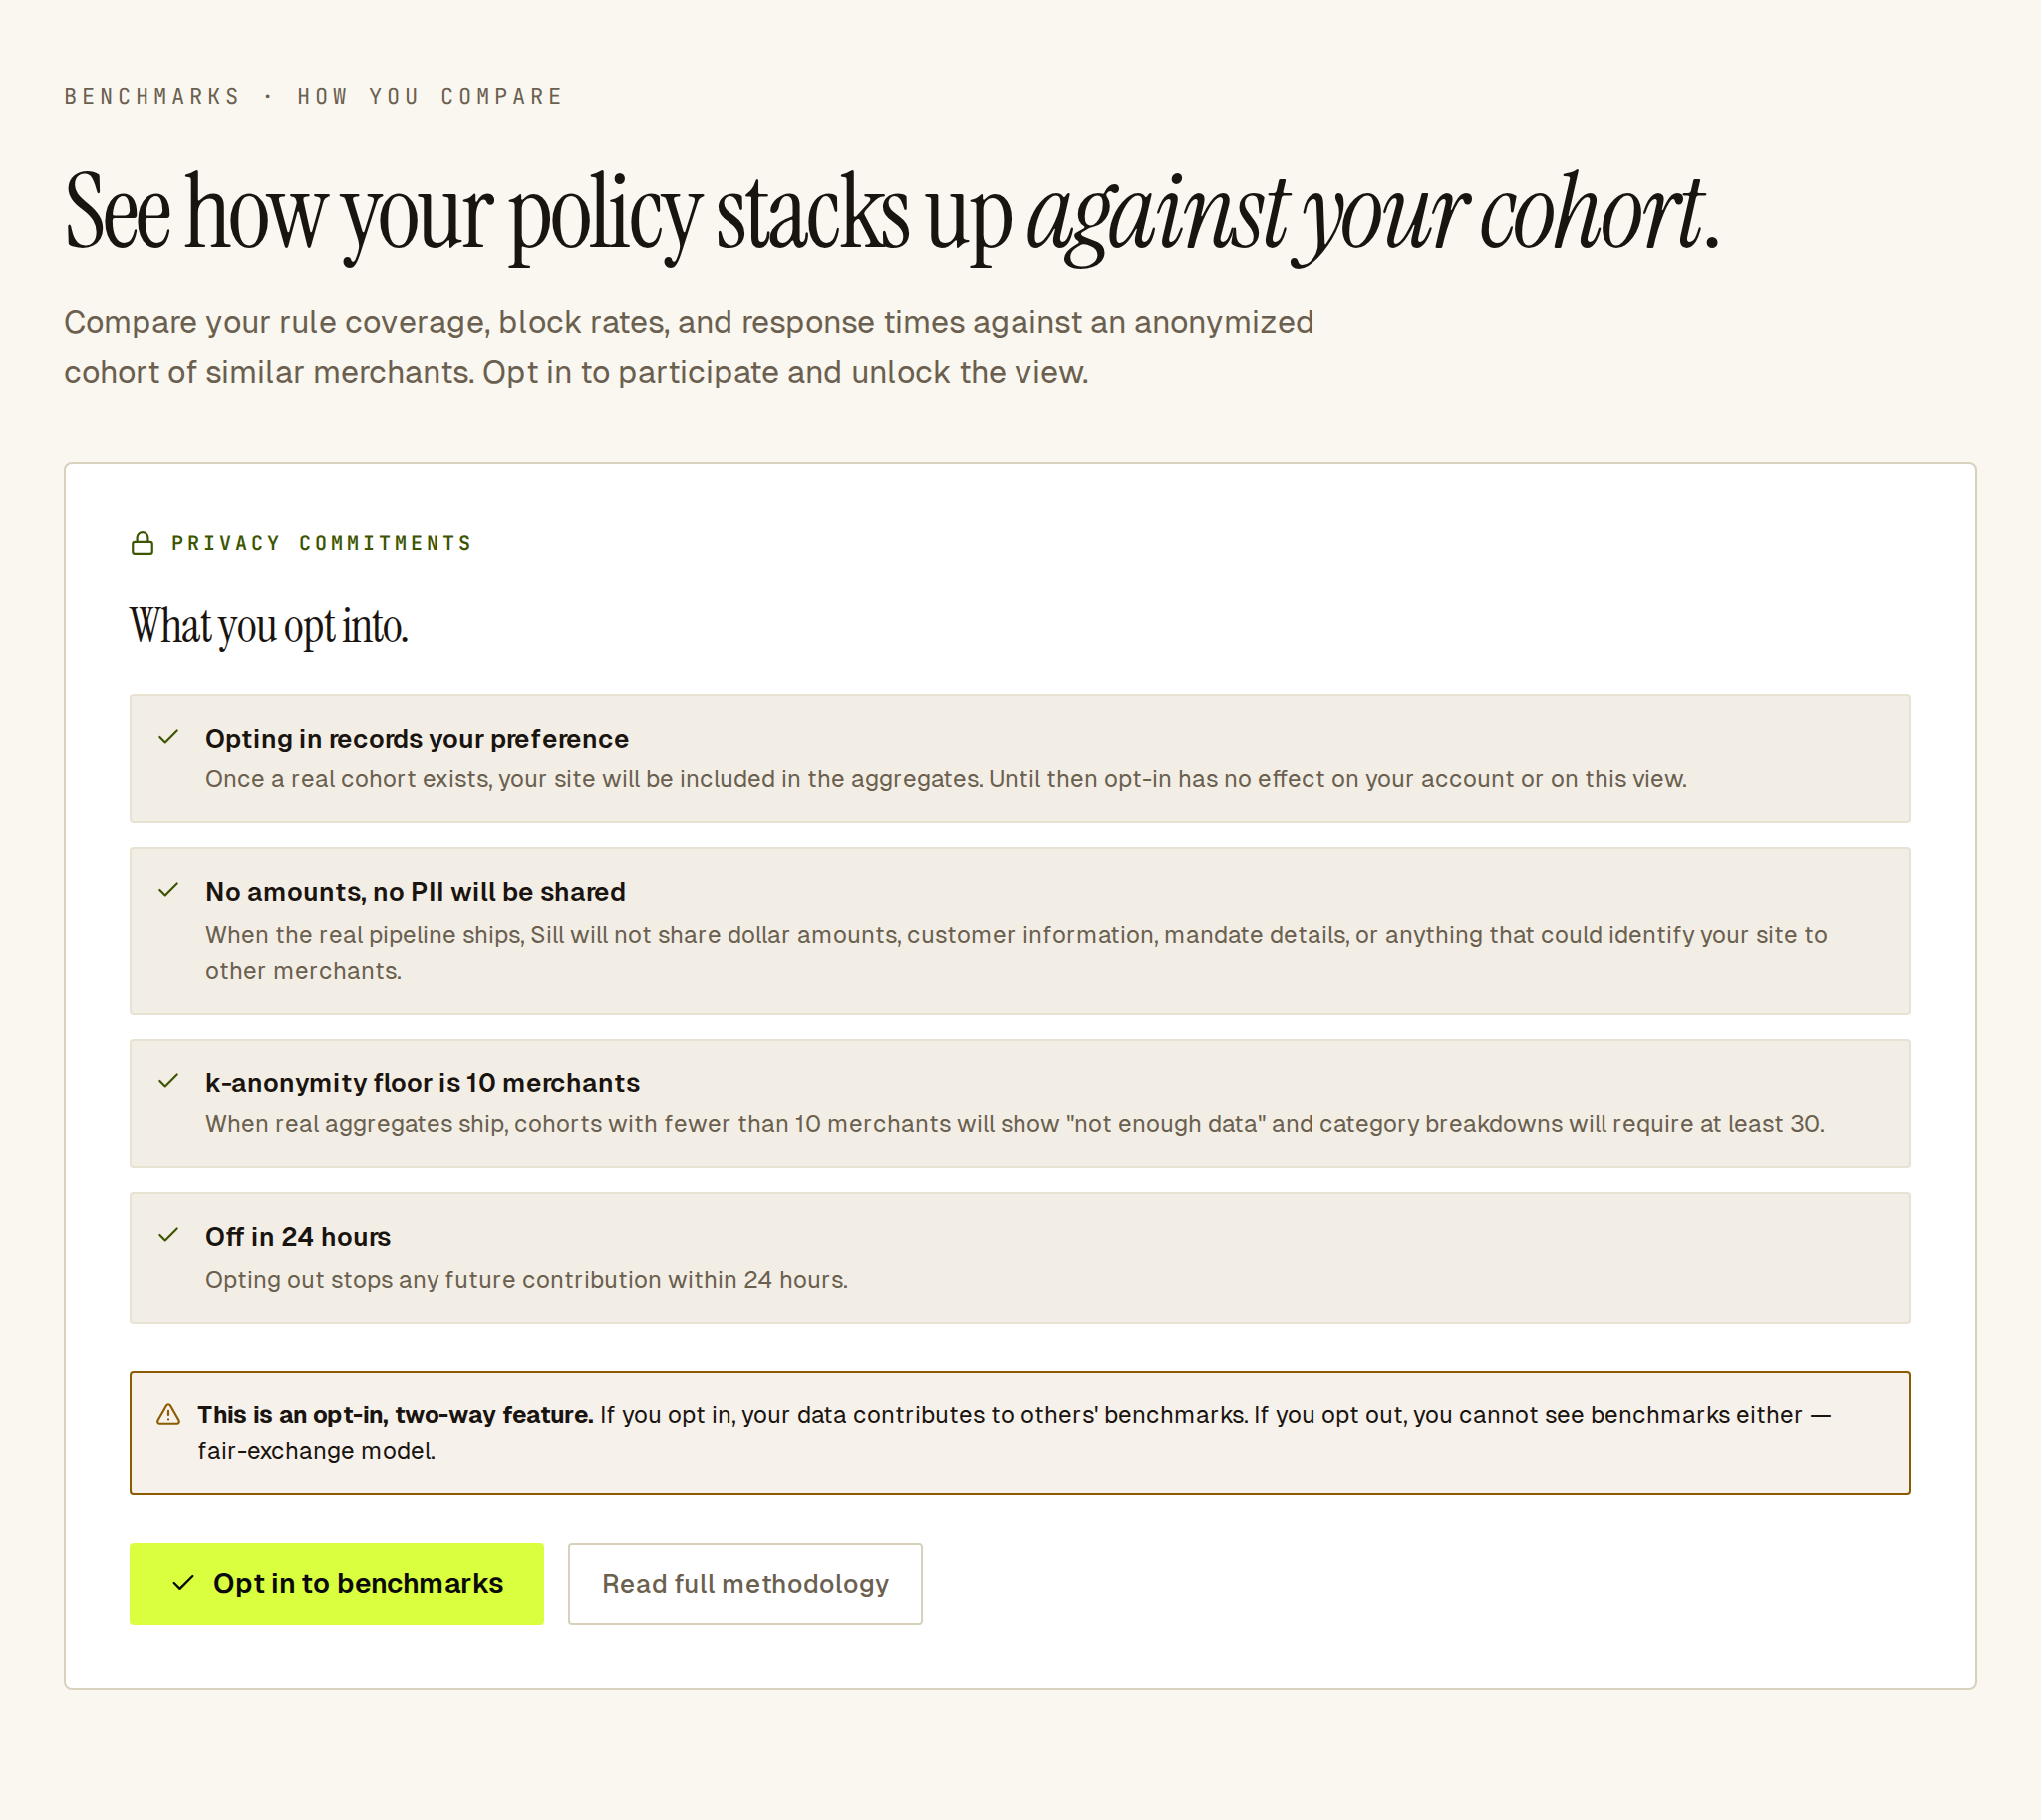
Benchmarks is opt-in per site. Until an owner or admin opts the site in, the view renders an opt-in gate with five privacy commitments and a single “Opt in to benchmarks” button.

The five commitments — ported verbatim from the dashboard’s opt-in gate — are:

  • Aggregated only. A site’s data is included in cohort statistics. Sill only displays aggregates with at least 10 merchants behind each number.
  • No amounts, no PII. Sill never shares dollar amounts, customer information, mandate details, or anything that could identify a site to other merchants.
  • Sales and marketing can’t see this data. Aggregates are scoped to merchant dashboards. Sill’s own go-to-market team has no access.
  • Off in 24 hours. Opting out stops new data within 24 hours. Existing aggregates are not re-derived.
  • k-anonymity floor. Cohorts with fewer than 10 merchants show “not enough data”. Category breakdowns require at least 30.

The gate also carries an amber notice: opting in and opting out are symmetric. Opting in means your data feeds other opted-in merchants’ cohorts. Opting out means you also lose your view of the cohort. The methodology modal says this literally: “The opt-out is total: you also lose access to view benchmarks.”

Only owner and admin roles can flip the opt-in state. Reviewers and viewers see the same page. If they attempt to opt in or opt out, the underlying POST returns 403.

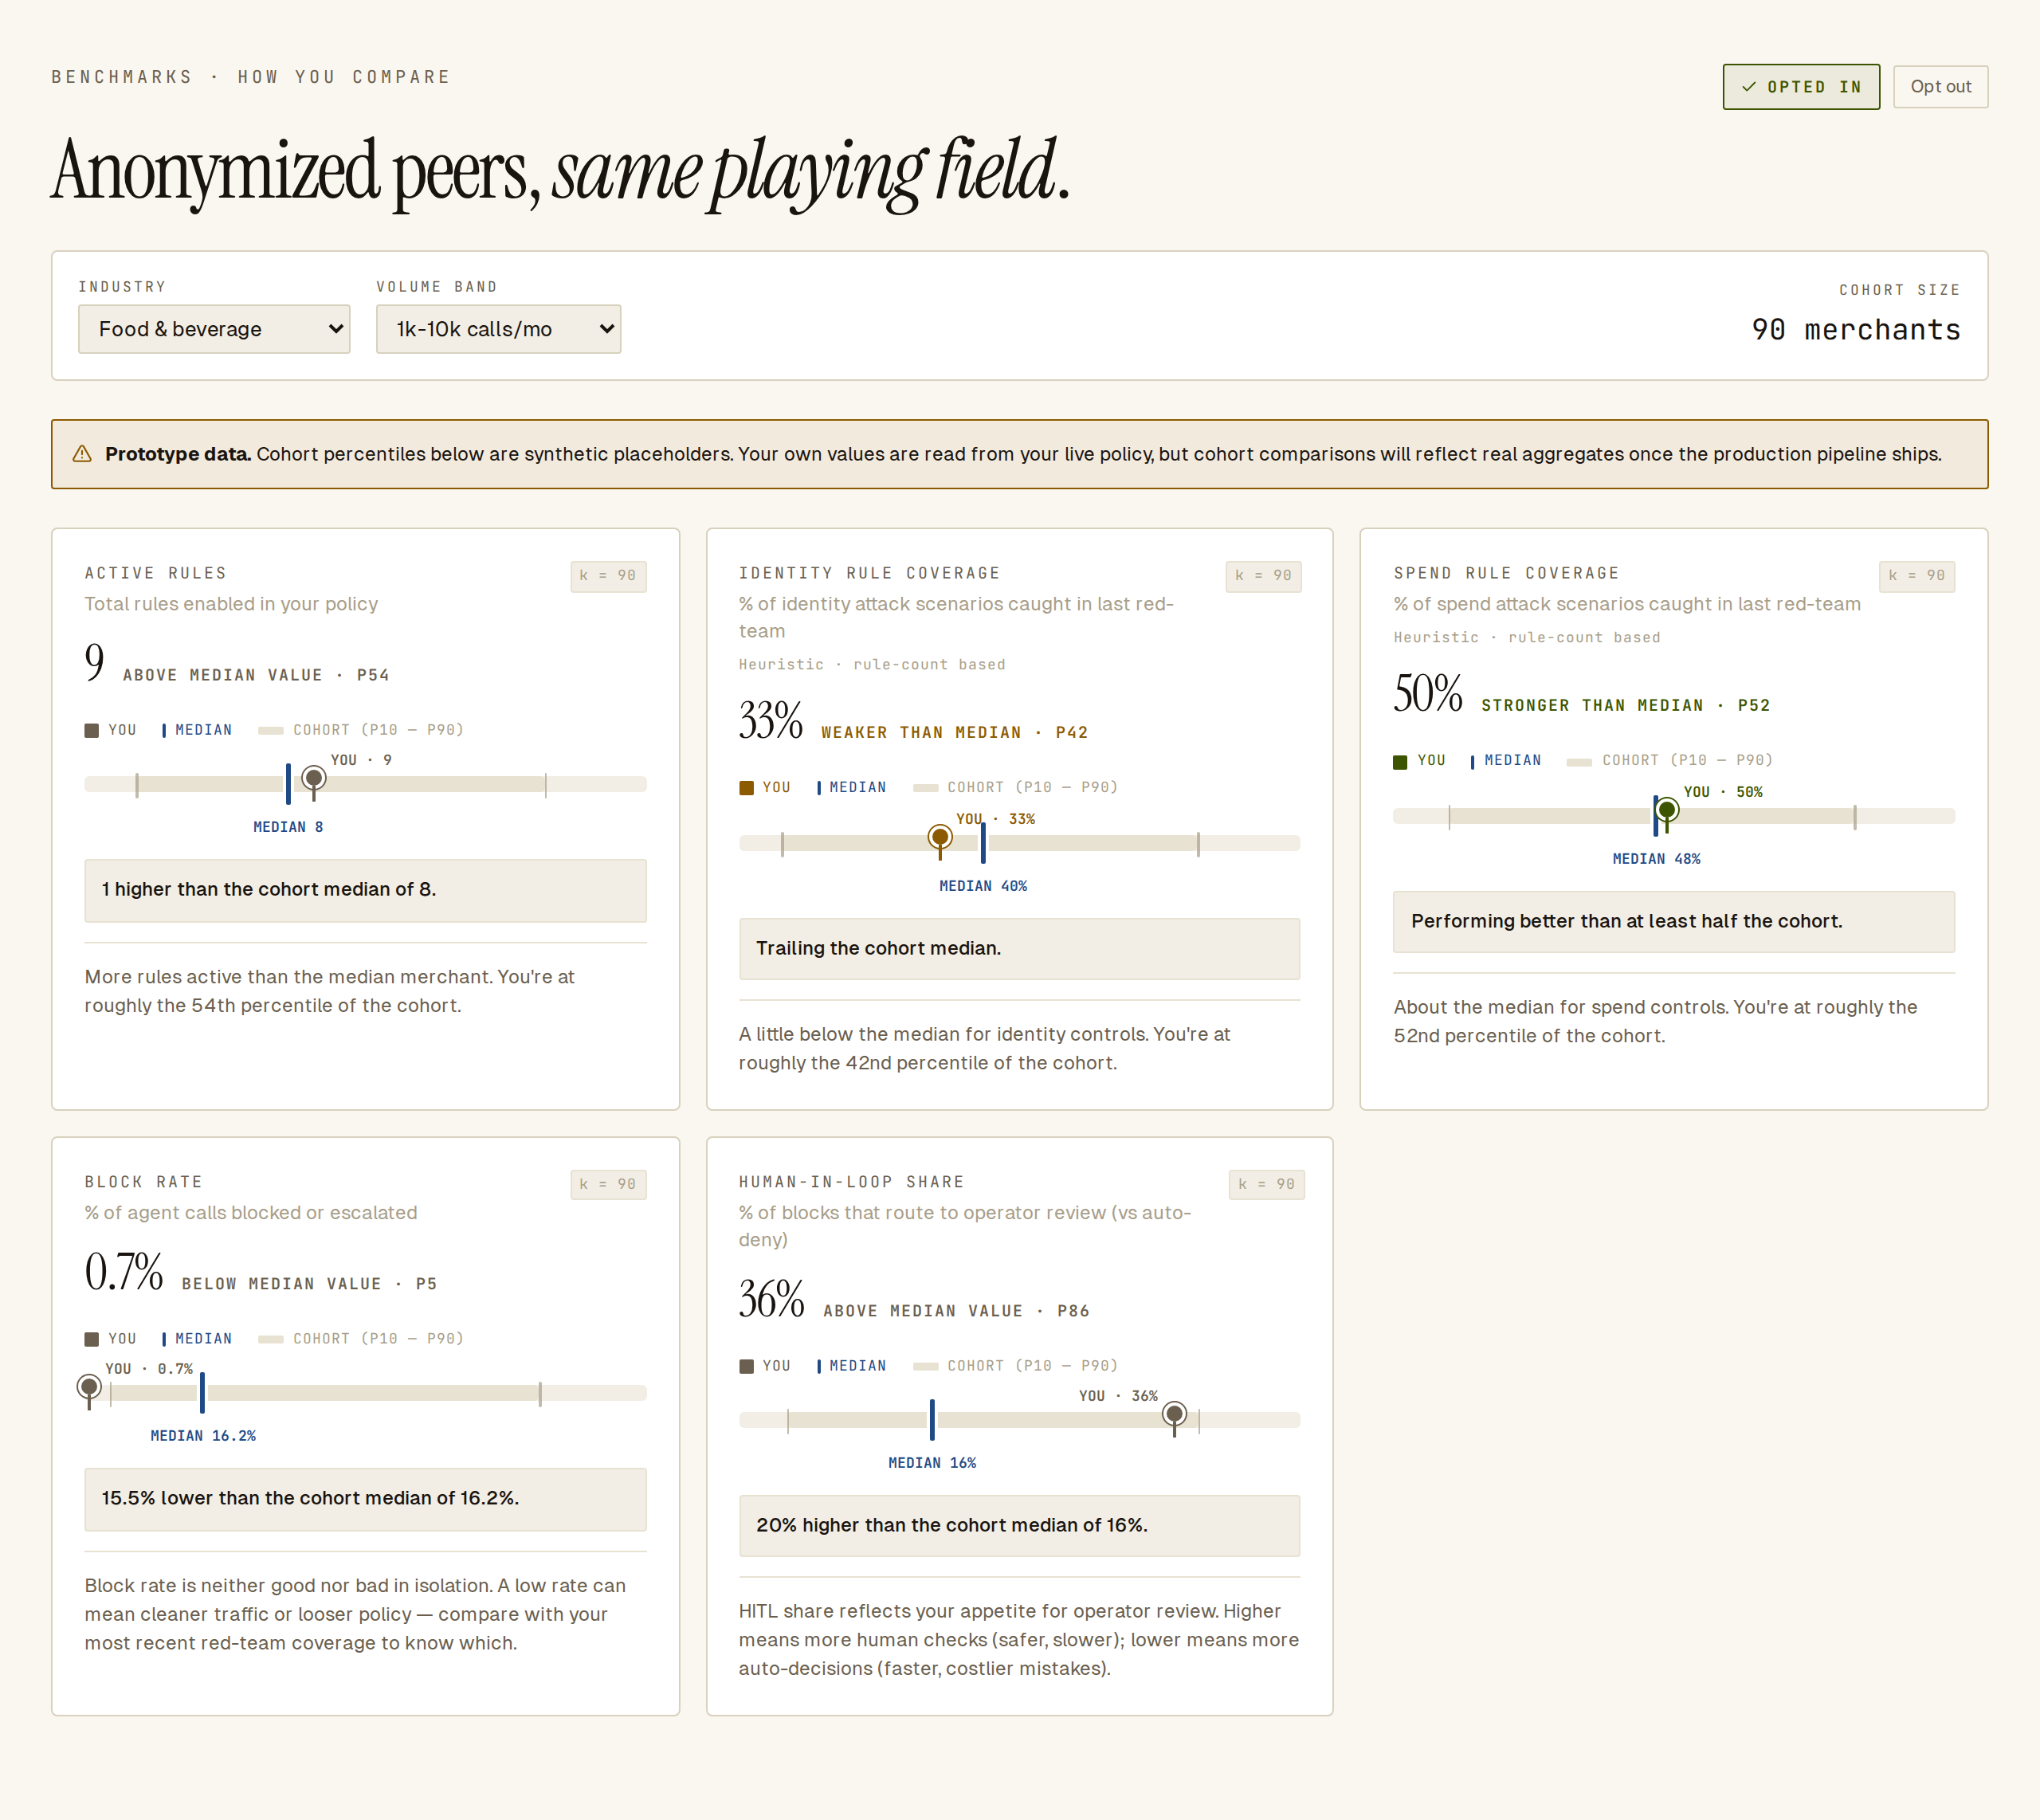
Once opted in, the page renders in three parts.

A two-field selector (industry and volume band) plus a live cohort-size readout.

FieldValues
IndustryFood & beverage · Apparel & accessories · Home & garden · Electronics · Health & beauty · Digital services · All industries
Volume band<1k calls/mo · 1k–10k calls/mo · 10k–100k calls/mo · 100k+ calls/mo
Cohort sizeThe merchant count for the selected (industry, volume_band) pair. Renders in coral when the cohort is below the display floor of 10.

Defaults on first open are Food & beverage + 1k–10k calls/mo. Changing either selector re-fetches the payload; the six cards update to the new cohort’s percentiles.

The card grid shows six metrics. Each card carries a plain-English interpretation, a verdict pill (bottom / typical / above / top), and a comparison strip anchored at cohort P10, cohort median, and cohort P90, with a needle at “yours”.

CardWhat “yours” meansProvenance
Rules enabledCount of enabled rules in the site’s active policyLive policy
Rule coverage · identityEnabled identity-category rule count against a target of six, capped at 100%Rule-count heuristic
Rule coverage · spendEnabled spend-category rule count against a target of six, capped at 100%Rule-count heuristic
Block rateShare of decisions in the last 30 days that were blocked or escalatedMetrics rollup
HITL shareShare of decisions in the last 30 days that were escalated to a human reviewerEscalation store
Mean decision msMean decision latency in the last 30 daysMetrics rollup

The two rule-coverage cards carry a small mono caption “Heuristic · rule-count based” under their subtitle. It is a per-card honesty signal: the coverage number is a rule-count proxy, not a measured coverage rate against adversarial inputs.

When there is no data yet for a metric on this site — for example, a fresh install, or a site that has not yet run any transactional mandates — the card’s yours value is null and the card renders a muted “Not enough data yet” state. It never substitutes a placeholder number.

Below the six-card grid — when the cohort is large enough — the page shows a per-category rules-enabled breakdown. There is one row per category: agent identity, rate limits, spend, scope, dark patterns, prompt injection. Each row has a “yours” bar and a cohort-median bar. The median bar is muted grey so the two are easy to tell apart. If you have zero rules in a category, a small tick still draws at the axis start — a zero always reads as a real zero, never as a rendering failure.

Benchmarks reads from Sill’s policy engine for policy numbers, and from the same signed audit records that back Audit log and export for the outcome numbers. For a canonical view of which protocol surfaces are user-ready today, see the Protocols grid.

k-anonymity floors — enforced at the server

Section titled “k-anonymity floors — enforced at the server”

Two floors gate the view. Both are enforced at the API before any cards are computed; the dashboard is a convenience, not the enforcement point.

  • k ≥ 10 to render any card. A cohort below 10 merchants shows a “COHORT TOO SMALL — not enough data to compare yet” card, and neither the six-card grid nor the breakdown are populated.
  • k ≥ 30 to render the category breakdown. A cohort with 10–29 merchants shows the six cards but replaces the breakdown with an amber muted notice: “Category breakdown requires at least 30 merchants in the cohort. This cohort has N.”

If the site is opted out, the server does not compute cards at all. The response’s cohort, cards, and category_breakdown are all null, whatever industry or volume band is selected. Watching your own network traffic will not surface cohort content while you are opted out or below the floor.

Every view state — opted out, opted in, cohort too small — carries a “Read full methodology” (or “How we calculate these”) button that opens a six-section modal:

  • Data pipeline. Aggregates are computed daily from an isolated pipeline that reads from each merchant’s policy and outcome metadata. The pipeline writes a single aggregates table; the dashboard reads from that table. Individual merchant data is never accessible to the benchmarks read path.
  • k-anonymity. Any displayed statistic requires at least 10 merchants in the cohort. Category breakdowns require at least 30. Cohorts below those thresholds show “not enough data” — the underlying numbers exist but are not exposed.
  • What is not shared. Dollar amounts, transaction values, GMV figures. Customer information (emails, IDs, names). Merchant identifiers or domain names. Specific mandate or audit details. Free-text rule descriptions or custom DSL.
  • What is shared. Count of enabled rules per category. Red-team coverage rates by category. Block / escalate / allow outcome rates. Mean decision time. Industry and traffic volume band (you choose your own).
  • Opt-out. Opting out stops new aggregation within 24 hours. Existing aggregates do not retroactively re-derive — but as new aggregates are computed, your data is no longer included. The opt-out is total: you also lose access to view benchmarks.
  • Never for marketing. Benchmark data is scoped to opted-in merchant dashboards. Sill’s sales and marketing teams have no access. The contractual representation is in the terms of service.

The copy above is what the dashboard renders today. It describes the target pipeline. In v1 the peer cohort itself is synthetic, and the page-level banner says so.

flowchart LR
  A[Benchmarks view] -->|GET /v1/sites/:site_id/benchmarks| B[Sill API]
  B -->|tenant-scoped read| C[(Your policy)]
  B -->|tenant-scoped read| D[(Your metrics rollup)]
  B -->|tenant-scoped read| E[(Your escalation store)]
  B -->|synthetic cohort constants v1| F[(Canonical peer values)]
  C --> B
  D --> B
  E --> B
  F --> B
  B -->|snake_case JSON<br/>cohort_is_synthetic: true| A

Every “yours” value comes from the caller’s own tenant-scoped tables. The peer percentiles are canonical constants keyed only on the two selectors (industry, volume band) — never on the caller — and are the same across every merchant for the same cohort. Responses carry Cache-Control: no-store, private.

Benchmarks is one read and two write endpoints under the active site. All three run under the caller’s tenant.

Terminal window
curl -H "Cookie: sill_session=..." \
"https://api.sill.so/v1/sites/01EXAMPLE00000000000000000/benchmarks?industry=food_bev&volume_band=mid"
{
"opt_in_state": "opted_in",
"opted_in_at": "2026-07-06T14:22:00.000Z",
"opted_out_at": null,
"cohort_is_synthetic": true,
"cohort": {
"industry": "food_bev",
"volume_band": "mid",
"cohort_size": 129,
"cohort_too_small": false
},
"cards": [
{
"id": "rules_enabled",
"title": "Rules enabled",
"subtitle": "Active guardrails in your policy",
"yours": 12,
"cohort_p10": 3,
"cohort_median": 9,
"cohort_p90": 21,
"unit": "",
"higher_is_better": true,
"interpretation": "You have more rules enabled than most peers.",
"cohort_size": 129,
"derived_from": "live_policy"
}
],
"category_breakdown": [
{ "category": "agent_identity", "label": "Agent identity",
"yours": 3, "cohort_median": 2 }
]
}

Opt-in and opt-out are separate, idempotent verbs. Both require an owner or admin session.

Terminal window
curl -X POST -H "Cookie: sill_session=..." \
"https://api.sill.so/v1/sites/01EXAMPLE00000000000000000/benchmarks/opt-in"
curl -X POST -H "Cookie: sill_session=..." \
"https://api.sill.so/v1/sites/01EXAMPLE00000000000000000/benchmarks/opt-out"

Unknown industry or volume_band values return 400 bad_request. A cross-tenant or unknown site_id returns 404. The dashboard surfaces that as an empty state — never as someone else’s data.

  • No cross-merchant lookup. The view never shows the values of any single other merchant. Every peer figure is a percentile or a median across at least 10 opted-in sites (30 for a category-breakdown row).
  • No dollar amounts, no PII. The wire schema has no revenue, no customer, no domain, no mandate detail on the cohort side. The comparison is about your enforcement setup, not commercial figures.
  • No cross-site rollups on the merchant side. Each Benchmarks page is scoped to a single site under the dashboard’s active tenant.
  • No claim about scaled multi-merchant peer data. In v1 the cohort side is the synthetic placeholder above. Marketing and public copy do not describe Sill as running a live cross-merchant benchmarking pipeline today.

Why is the peer cohort synthetic in v1? The view is enabled now so a merchant sees populated content on day one, and so the opt-in and k-anonymity enforcement gets real production use. The cross-merchant aggregation pipeline is a separate future deliverable. Until it ships, the peer numbers are honest placeholders and the amber “Prototype data.” banner says so on every render.

Why does opting out remove my access? The view is designed as a fair exchange: a merchant sees peer aggregates because it also contributes to them. If a merchant opts out, both directions stop. The pipeline treats “sees benchmarks” and “contributes to benchmarks” as one flag, not two.

Why is the cohort selector a fixed list, not free text? So cohort sizes are predictable and the k-anonymity floor is one a merchant can actually reason about. A free-text industry or volume band would splinter cohorts below the display floor and defeat the point.

Why do the two coverage cards say “Heuristic · rule-count based”? In v1 the two rule-coverage cards are computed from a rule count against a target of six per category. That is a proxy for real coverage against adversarial inputs, not the same thing. The per-card caption labels the proxy honestly, so a reader does not treat “83% identity coverage” as a measured rate.

Is the response signed? No. The benchmarks payload is a server-computed summary of your own tenant-scoped data plus the canonical cohort constants. The underlying audit records that feed the “yours” metrics are individually signed and Merkle-chained. The summary itself is a projection, not an evidentiary artifact. For verifiable evidence use the audit bundle export and Verify a signature.

  • Guardrails — the policy surface whose active rules populate the rules-enabled and rule-coverage cards.
  • Reporting — the per-site KPI + traffic surface that shares the same metrics rollup.
  • Audit log and export — the signed records the “yours” block-rate and decision-time metrics summarise.
  • Users and roles — the owner and admin roles that can flip the benchmarks opt-in.
  • Sites and onboarding — adding and verifying the site the view is scoped to.